Imagine pouring hours into crafting the perfect Instagram post, only to watch it flop while a competitor's Reel skyrockets to thousands of views. Here's the harsh truth: Instagram analytics is the secret weapon that separates thriving accounts from stagnant ones. According to Later, focusing on Reels can deliver 20% more reach, but without data, you're shooting in the dark. In 2024, top creators and brands use insights to track reach, engagement, and follower growth, achieving up to 5% monthly growth. This guide dives deep into Instagram analytics—how to access it, key metrics, and proven strategies to supercharge your growth. Ready to turn data into dominance?
Unlocking Instagram Insights: The Foundation of Instagram Analytics
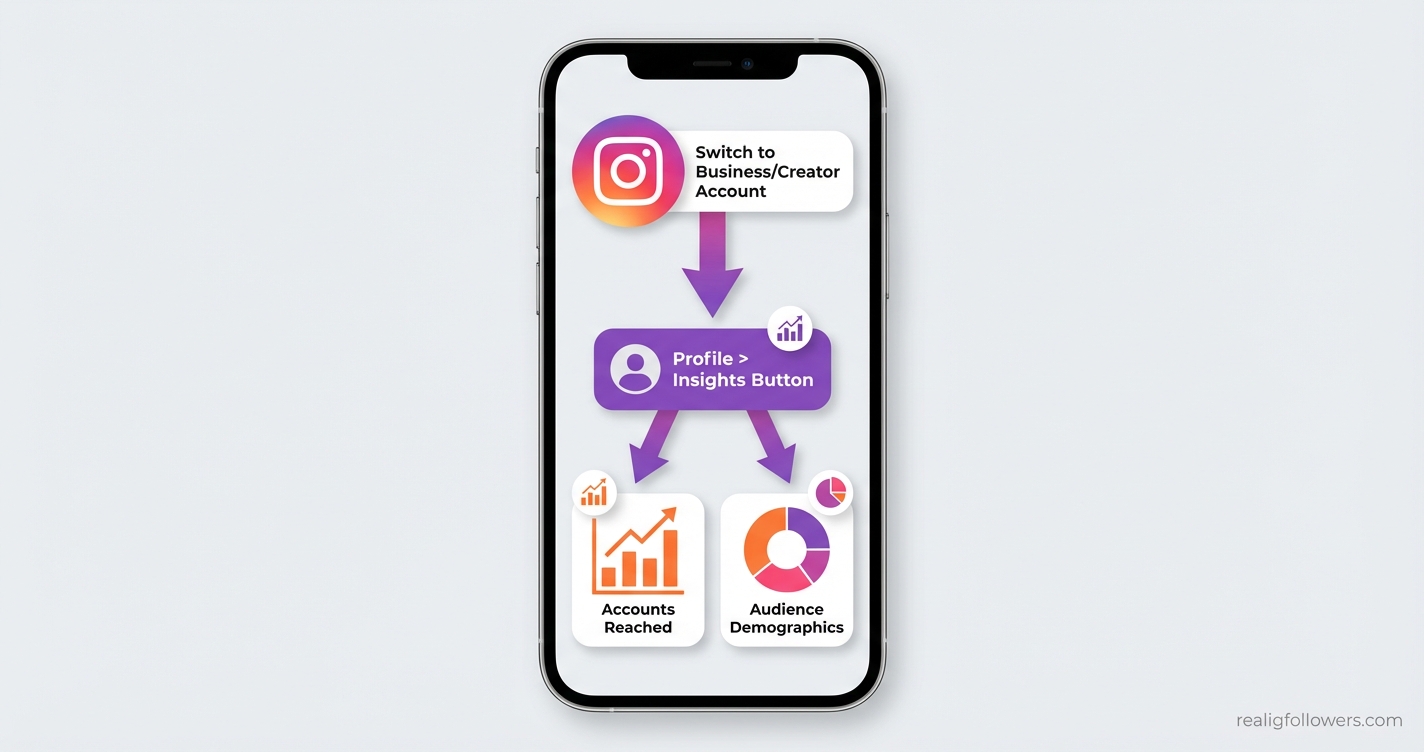
Instagram's native Instagram analytics, called Insights, is your professional dashboard for demystifying performance. Available only to business or creator accounts, it reveals metrics like reach, impressions, and engagement that power the algorithm. Switch your account via Settings > Account type > Switch to professional account—it's free and reversible.
Once inside, navigate to your profile and tap Insights for an overview. Hootsuite notes this dashboard tracks audience demographics, best posting times, and content performance, helping you optimize for growth. For instance, profile visits spiked 30% for brands analyzing top content weekly.
Why Native Insights Matter for Beginners
- Reach vs. Impressions: Reach counts unique accounts; impressions tally total views—track both for visibility.
- Audience data: Age, gender, locations, and active times inform targeted posting.
- Story and Reel views: Crucial since Instagram favors these formats.
Pro Tip: Check Insights daily for the last 7 days, then weekly for 30-day trends. Link to our Instagram for Business Guide for full setup.
Key Instagram Analytics Metrics to Track for Explosive Growth
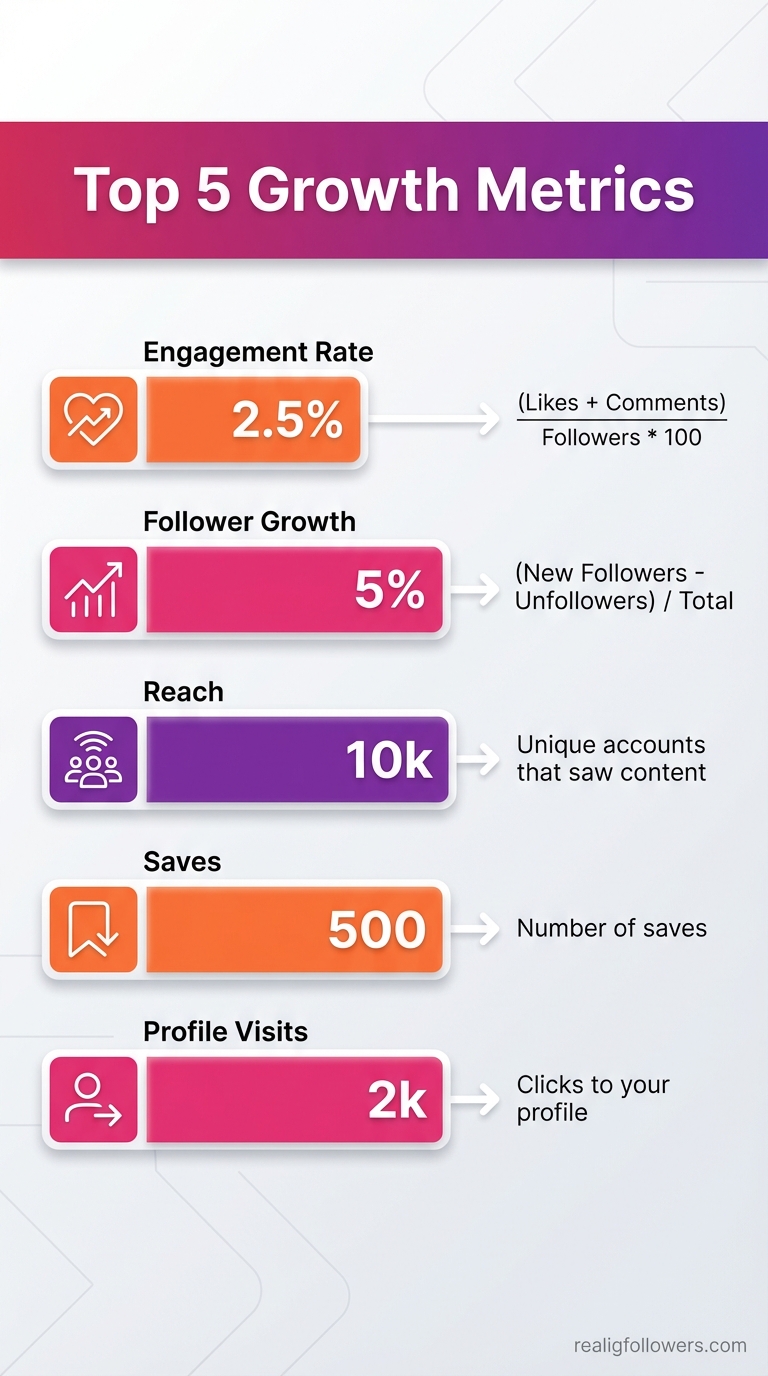
To improve your Instagram analytics-driven growth, focus on these core metrics. Sprout Social highlights reach, impressions, engagement rate, and follower growth as essentials. Calculate engagement rate as (likes + comments + saves) / reach * 100—Buffer recommends aiming for 1-3% as a benchmark.
Follower growth rate tracks net new followers monthly; target 5% per Later. Saves and shares predict virality, per Hootsuite hacks—content with high saves signals algorithm love.
Top Metrics Breakdown
- Profile Visits & Website Clicks: Gauge interest leading to conversions.
- Accounts Engaged: Ratio to reached accounts shows resonance (Hack #1 from Hootsuite).
- Reel/Story Views: Reels drive 20% more reach.
Example: A fitness influencer tracked saves, replicated top recipes, and grew 15% in followers. Benchmark against industry averages via tools like Sprout Social.
Read our Best Instagram Growth Tools 2026 for more.
Analyzing Audience Demographics and Optimal Posting Times
Your audience insights in Instagram analytics reveal who follows you—age, gender, cities, and peak active hours. Use this to post when they're online, boosting engagement by up to 25% (Hootsuite). Insights show top locations and times; for US audiences, evenings often peak.
Hootsuite Hack #2: Factor in timezones—post for global reach. Demographics guide content: If 70% female 18-24, tailor trends accordingly.
- Steps: Insights > Audience > See All for full data.
- Action: Schedule via Buffer or native tools at peak windows.
- Example: A coffee brand found Saturday 9 AM optimal, impressions up 40%.
Pair with our Best Times to Post on Instagram research.
Leveraging Instagram Analytics for Content Optimization
Drill into post performance to replicate winners. Track top content types—carousels often outperform singles. A/B test captions (Hootsuite tip) and analyze via Insights > Content > Top Posts.
Focus on saves for long-term growth (Buffer). Reels and Stories get algorithm favoritism; track views and replies. Later reports carousel posts excel for engagement.
Optimization Checklist
- Identify top performers: Repurpose themes.
- Monitor posting frequency: Data shows 3-5x/week ideal.
- Collaborate for shoutouts: Track referral traffic.
Case Study: Brand X analyzed Reels, focused on tutorials, follower growth hit 10%. Explore Instagram Reels Strategy.
Advanced Tools and Competitor Analysis in Instagram Analytics
Native Insights are great starters, but third-party tools like Hootsuite, Buffer, Later, or Sprout Social unlock trends, exports, and competitor benchmarking. Hootsuite Hack #4: Use public metrics and tools to spy—track rivals' engagement rates.
Visualize data over time; set KPIs like 5% growth. Automate reports (Hack #5) to iterate fast. Integrate for cross-platform views.
- Hootsuite: Competitor dashboards.
- Later: Visual calendars with analytics.
- Pro Insight: Benchmark 'Accounts Reached' vs. Engaged ratios.
A marketer benchmarked vs. peers, adjusted strategy, grew 3x faster.
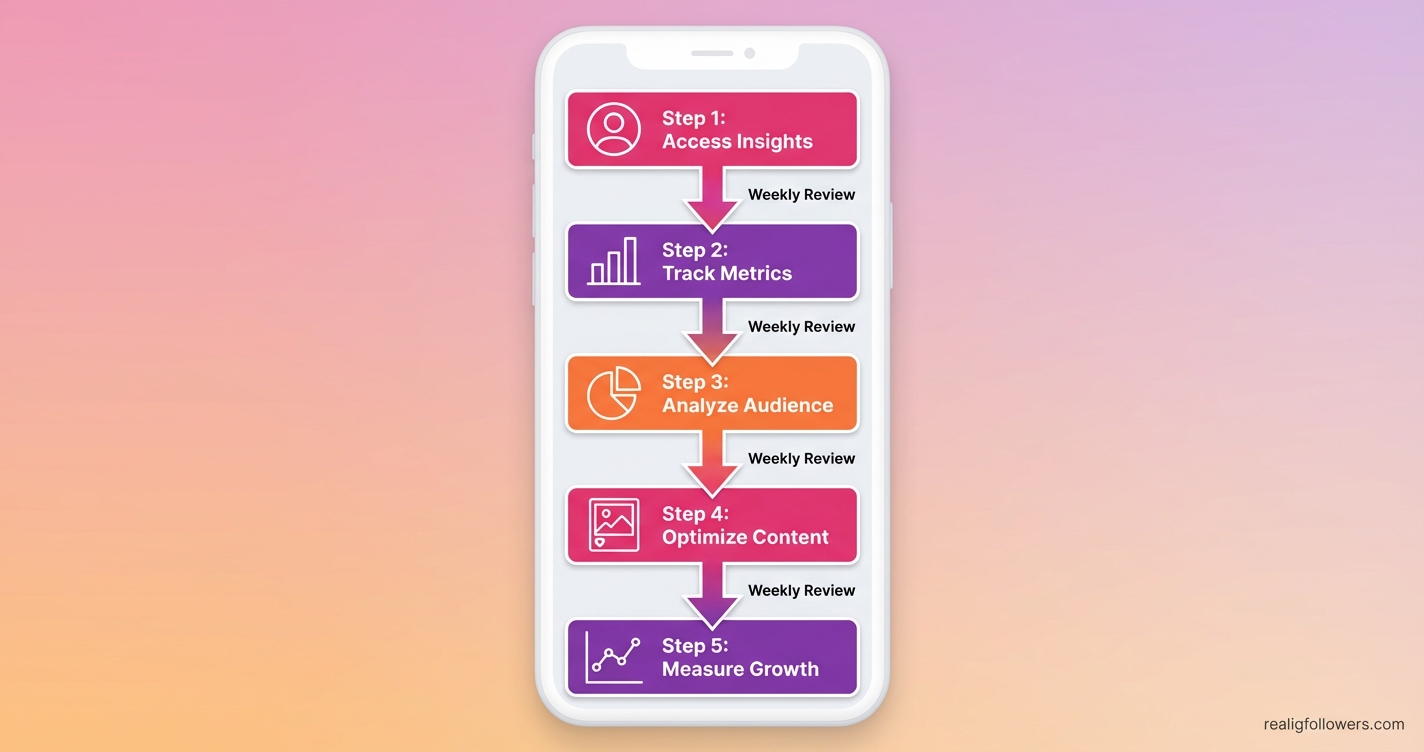
Step-by-Step Action Plan: Implement Instagram Analytics Today
Turn insights into action with this hands-on guide:
- Week 1: Setup & Baseline—Switch to pro account, review 30-day metrics, note top posts/times.
- Week 2: Deep Dive—Analyze audience, calculate engagement rate, export data.
- Week 3: Optimize—Post at peaks, A/B test, prioritize Reels/carousels.
- Ongoing: Iterate—Weekly reviews, track growth KPIs, benchmark competitors.
- Scale—Use tools for automation, collaborate based on data.
Expected: 5-10% growth in first month. Track progress with Instagram Analytics Guide.
Frequently Asked Questions
How do I access Instagram analytics?
Switch to a business or creator account in Settings. From your profile, tap 'Insights' for metrics like reach and engagement. It's free and shows data for the past 7-90 days. Use third-party tools like Hootsuite for deeper access.
What is a good Instagram engagement rate?
Aim for 1-3% using (likes + comments + saves)/reach * 100. Top accounts hit 5%+. Track via Insights and benchmark industry averages with Sprout Social—focus on saves for quality engagement.
Can personal accounts see Instagram analytics?
No, only professional accounts. Convert easily without losing followers. Personal accounts lack Insights, so upgrade for growth data on audience, content, and Stories.
Do third-party tools improve Instagram analytics?
Yes—Buffer, Later, and Hootsuite offer trends, scheduling, exports, and competitor analysis beyond native tools. Automate reports to save time and spot growth opportunities faster.
How often should I check Instagram analytics?
Daily for new posts, weekly for trends, monthly for KPIs like follower growth. Hootsuite recommends automating to focus on action over manual checks.
Conclusion: Master Instagram Analytics for Sustainable Growth
Instagram analytics isn't just numbers—it's your roadmap to smarter growth. Key takeaways: Track reach, engagement, saves; post at peak times; optimize with Reels and data-driven tests. Brands using these see 20%+ reach boosts and steady follower gains.
Start today: Audit your Insights, set 5% growth goals, and iterate. For more, check How to Get Real Instagram Followers. What's your first metric to track? Drop it below and grow exponentially!